Back to SentiCharts


Next update in
00
:
00
:
00
M&M'S
Food
#11
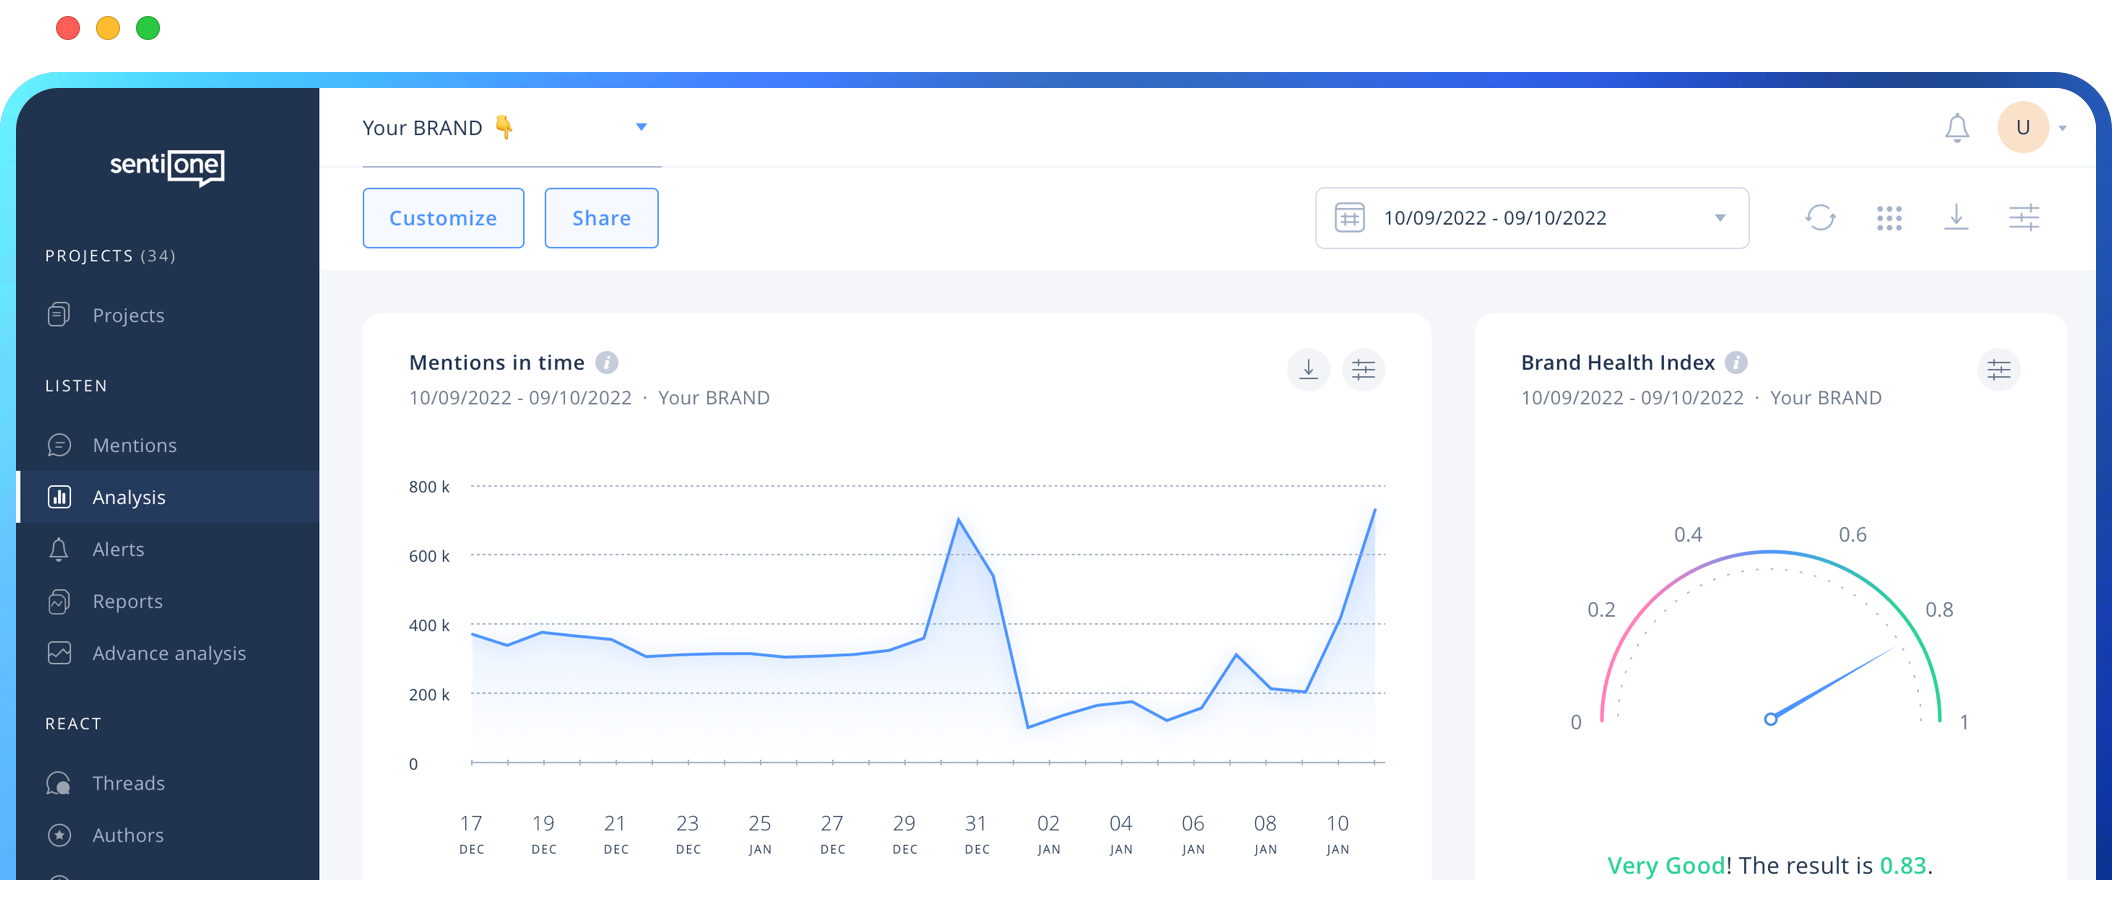
Social index
560
Mentions
1 447
BHI
0.36
This is a simplified view of SentiOne charts and graphs.
Would you like to see a more interactive version?
This is a simplified view of SentiOne charts and graphs.
Thanks for getting in touch!
Displays the reach of all results found within a given project, divided by sentiment and sources.
| Sentiment | Reach |
|---|---|
| Positive | 184267 |
| Negative | 716794 |
| Total | 22990132 |
| Source | Reach |
|---|---|
| Webpages | 1051937 |
| Social Media | 4297336 |
| Total | 22990132 |
| Source | Reach |
|---|---|
| Blogs | 232966 |
| Forums | 3546 |
| Websites | 809425 |
| 882066 | |
| 116890 | |
| Video | – |
| Reviews | 6000 |
| 3298380 | |
| TikTok | 17640870 |
Unlock more graphs, charts and insights!
Book a free demo to see all possibilities of online monitoring. Let’s analyse your brand, competition or any social trend!
Book a demoThis is a simplified view of SentiOne charts and graphs.
Would you like to see a more interactive version?
This is a simplified view of SentiOne charts and graphs.
Thanks for getting in touch!